
Data Mining BSIT 7 Semester/Term PU — University of the Punjab 2025
Discussion
Ask a question about this paper, or help someone else with theirs. Answers are emailed to whoever asked.
No questions yet — be the first to ask.
More Data Mining papers
See all Data Mining - University of Sargodha Terminal Examinations Fall 2025 Program BS(IT) 7th (Reg & SS1) Part 1
Uploaded 6 months ago
Download ↓
Data Mining - University of Sargodha Terminal Examinations Fall 2025 Program BS(IT) 7th (Reg & SS1) Part 1
Uploaded 6 months ago
Download ↓
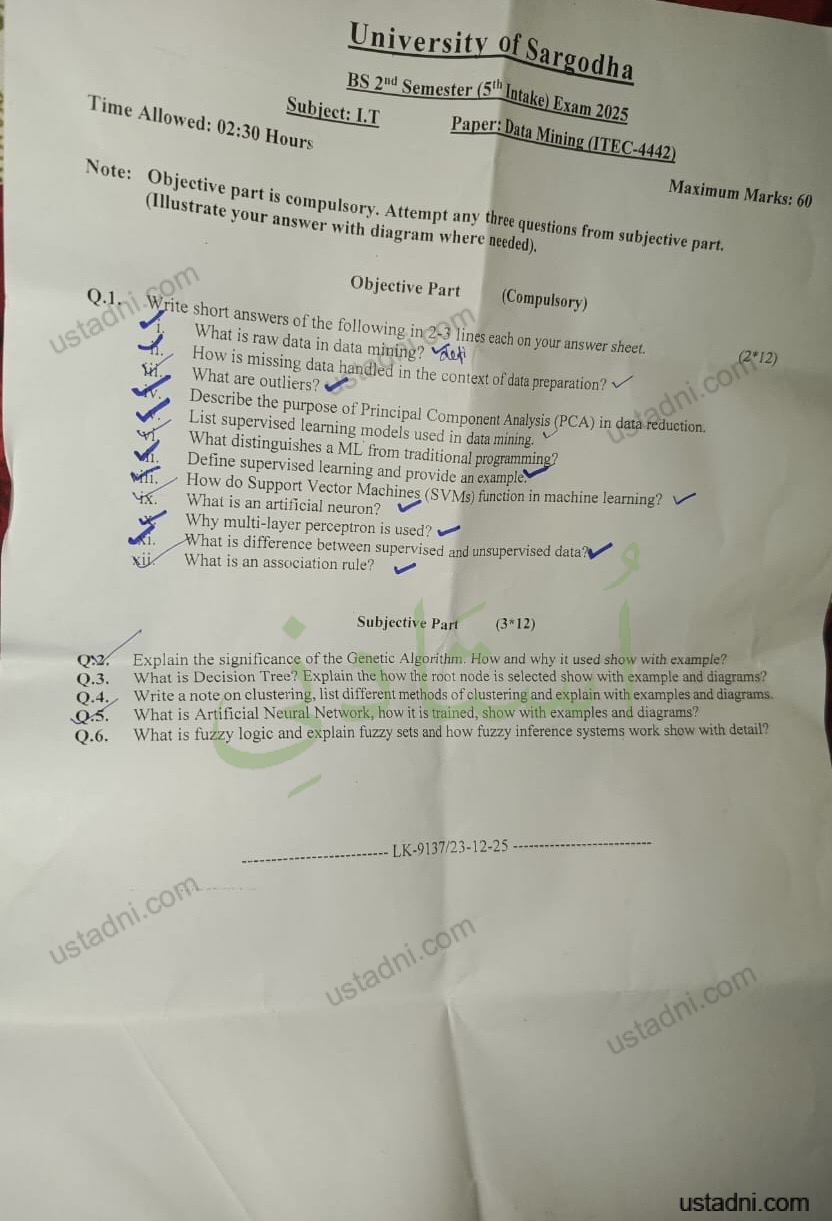 Data Mining BSIT 2/5 Semester/Term University Of Sargodha (UOS) 2025
Uploaded 8 months ago
Download ↓
Data Mining BSIT 2/5 Semester/Term University Of Sargodha (UOS) 2025
Uploaded 8 months ago
Download ↓
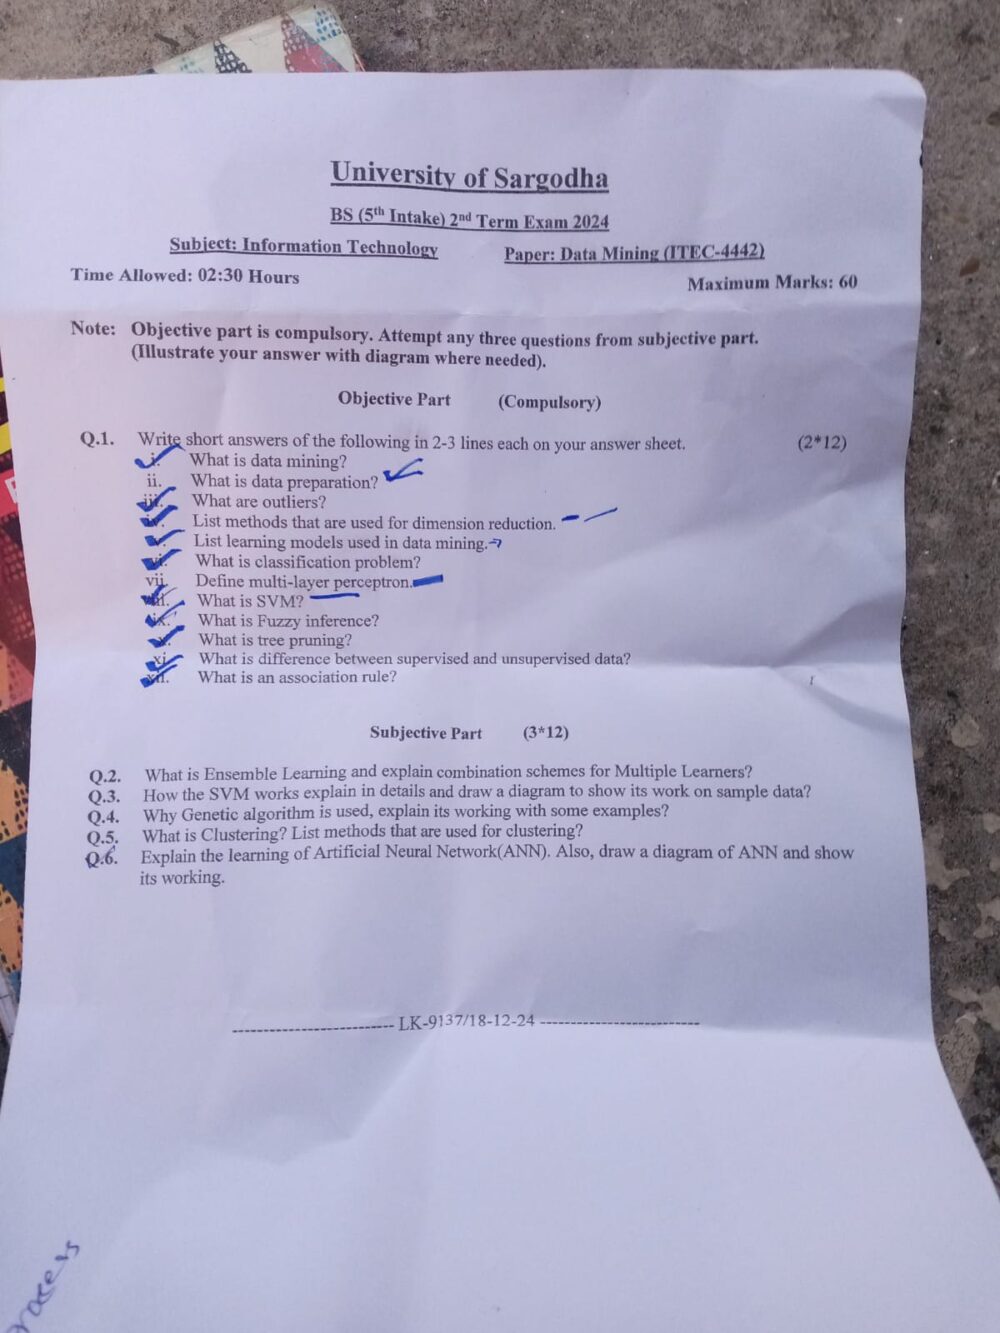 Data Mining BS 2 Semester/Term University Of Sargodha (UOS) 2024
Uploaded 1 year ago
Download ↓
Data Mining BS 2 Semester/Term University Of Sargodha (UOS) 2024
Uploaded 1 year ago
Download ↓
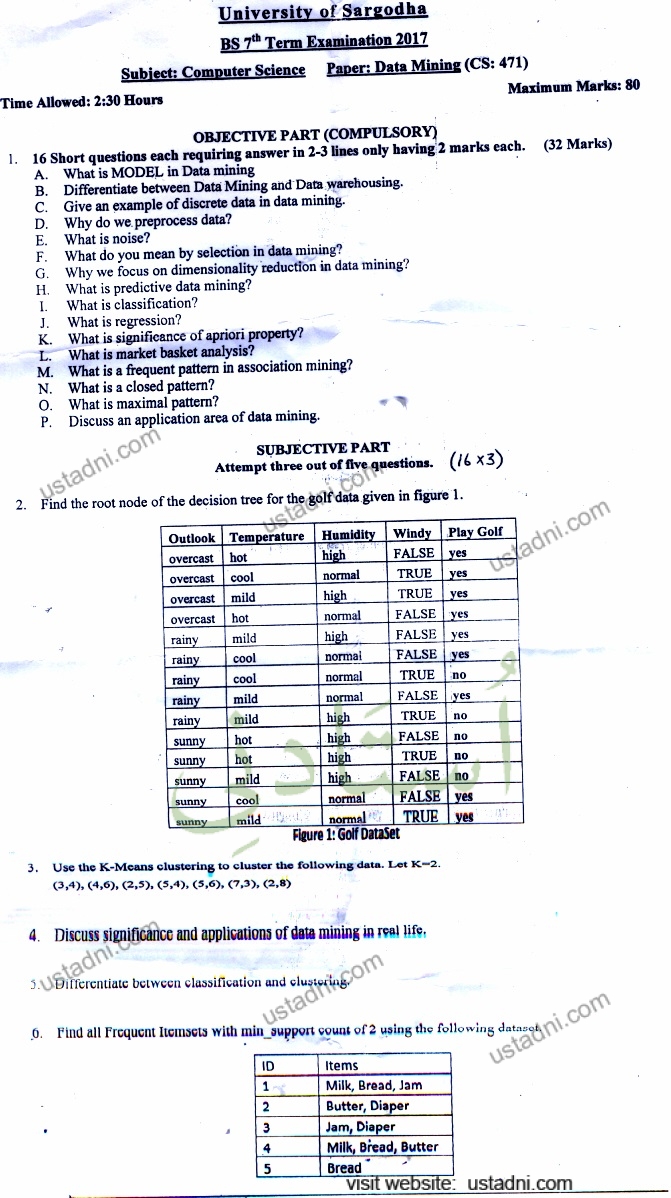 Data Mining BSCS 2016 Paper#2 UOS
Uploaded 3 years ago
Download ↓
Data Mining BSCS 2016 Paper#2 UOS
Uploaded 3 years ago
Download ↓
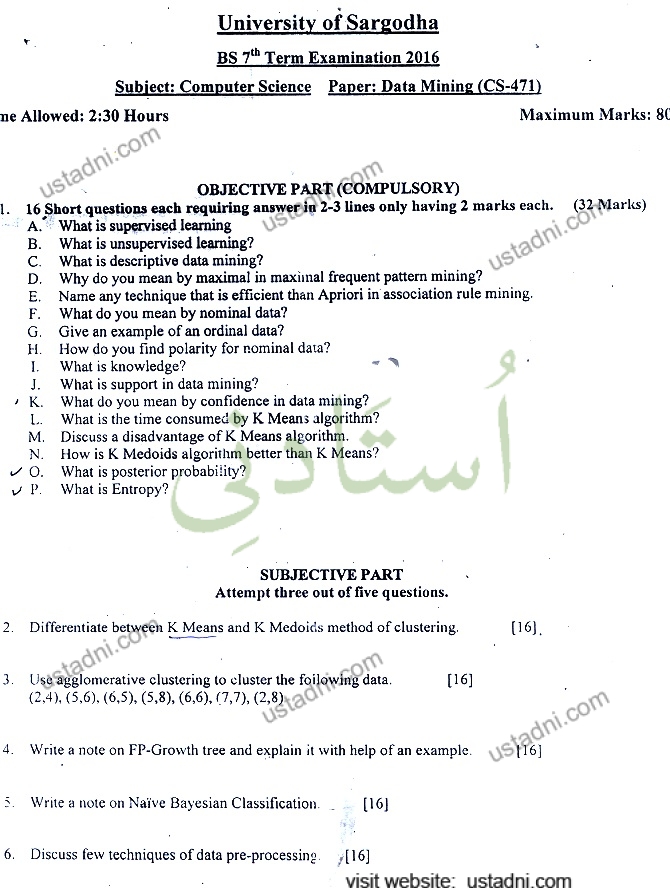 Data Mining BSCS 2016 UOS
Uploaded 3 years ago
Download ↓
Data Mining BSCS 2016 UOS
Uploaded 3 years ago
Download ↓
Paper text
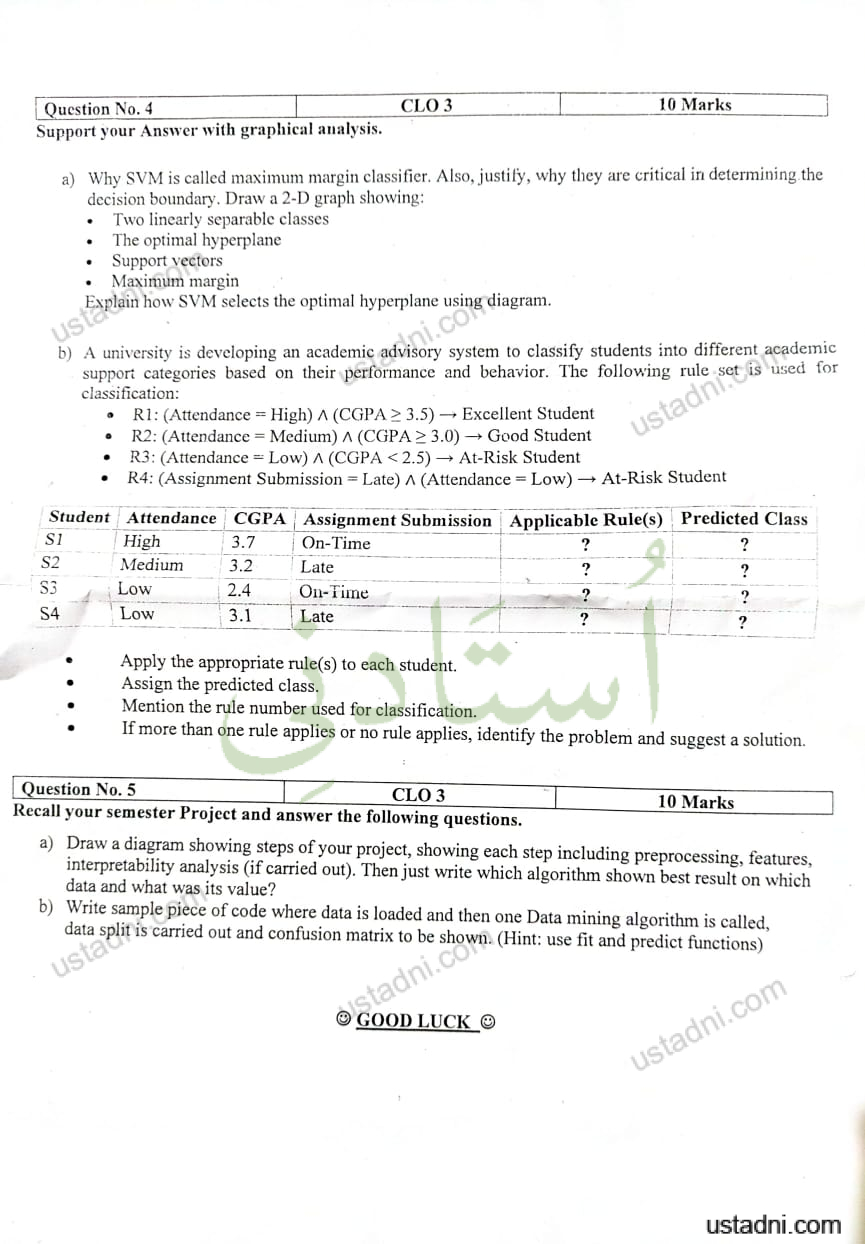
Question No. 4
Support your Answer with graphical analysis.
CLO 3
10 Marks
a) Why SVM is called maximum margin classifier. Also, justify, why they are critical in determining. the
decision boundary. Draw a 2-D graph showing:
• Two linearly separable classes
• The optimal hyperplane
• Support vectors
• Maximum margin
Explain how SVM selects the optimal hyperplane using diagram.
b)
A university is developing an academic advisory system to classify students into different academic
support categories based on their performance and behavior. The following rule set is used for
classification:
R1: (Attendance = High) ^ (CGPA ≥3.5) → Excellent Student
• R2: (Attendance = Medium) ^ (CGPA ≥ 3.0) → Good Student
• R3: (Attendance = Low) ^ (CGPA < 2.5) → At-Risk Student
• R4: (Assignment Submission = Late) ^ (Attendance = Low) → At-Risk Student
S2
S3
S4
Student
Attendance
High
Medium
Low
Low
CGPA | Assignment Submission
_Applicable Rule(s)
3.7
3.2
2.4
3.1
On-Time
?
Late
On-Time
?
Late
Predicted Class
?
•
Apply the appropriate rule(s) to each student.
Assign the predicted class.
Mention the rule number used for classification.
If more than one rule applies or no rule applies, identify the problem and suggest a solution.
Question No. 5
CLO 3
Recall your semester Project and answer the following questions.
10 Marks
a) Draw a diagram showing steps of your project, showing each step including preprocessing, features,
interpretability analysis (if carried out). Then just write which algorithm shown best result on which
data and what was its value?
b) Write sample piece of code where data is loaded and then one Data mining algorithm is called,
data split is carried out and confusion matrix to be shown. (Hint: use fit and predict functions)
© GOOD LUCK ®
ustadni.com
ustadni.com