
University of Sargodha BS 2ª Term Examination 2015 Paper: Probability & Statistics (Math-2110) Subject: Computer Science Time Allowed: 2:30 Hours Maximum Marks: 80
Discussion
Ask a question about this paper, or help someone else with theirs. Answers are emailed to whoever asked.
No questions yet — be the first to ask.
More Probability and Statics papers
See all Probability and Statics ADP IT/BSIT 3 Semester/Term University Of Sargodha (UOS) 2026
Uploaded 3 months ago
Download ↓
Probability and Statics ADP IT/BSIT 3 Semester/Term University Of Sargodha (UOS) 2026
Uploaded 3 months ago
Download ↓
 Probability and Statics ADP/BS 2 Semester/Term University Of Sargodha (UOS) 2025
Uploaded 10 months ago
Download ↓
Probability and Statics ADP/BS 2 Semester/Term University Of Sargodha (UOS) 2025
Uploaded 10 months ago
Download ↓
 Probability and Statics BSCS University Of Sargodha (UOS) 2021
Uploaded 2 years ago
Download ↓
Probability and Statics BSCS University Of Sargodha (UOS) 2021
Uploaded 2 years ago
Download ↓
 Probability and Statics BS 2 Semester/Term University Of Sargodha (UOS) 2021
Uploaded 2 years ago
Download ↓
Probability and Statics BS 2 Semester/Term University Of Sargodha (UOS) 2021
Uploaded 2 years ago
Download ↓
 Probability and Statics BS Statistics/MPhil Information Technology 2 Semester/Term University Of Sargodha (UOS) 2020
Uploaded 2 years ago
Download ↓
Probability and Statics BS Statistics/MPhil Information Technology 2 Semester/Term University Of Sargodha (UOS) 2020
Uploaded 2 years ago
Download ↓
 Probability and Statics BSSE 2015 Mid Term UOS
Uploaded 3 years ago
Download ↓
Probability and Statics BSSE 2015 Mid Term UOS
Uploaded 3 years ago
Download ↓
Paper text
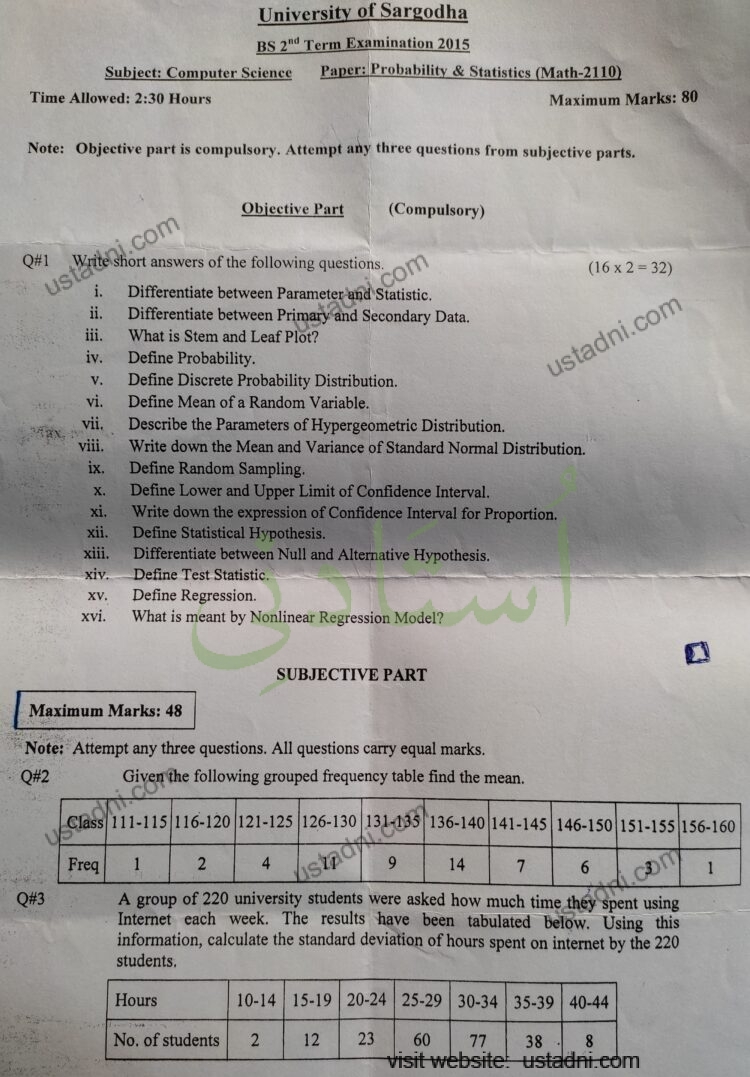
University of Sargodha
BS 2ª Term Examination 2015
Paper: Probability & Statistics (Math-2110)
Subject: Computer Science
Time Allowed: 2:30 Hours
Maximum Marks: 80
Note: Objective part is compulsory. Attempt any three questions from subjective parts.
(Compulsory)
Q#1
Objective Part
Write short answers of the following questions.
i.
ii.
iii.
iv.
V.
vi.
vii.
vill.
ix.
x.
xi.
xii.
Xili.
XiV.
XV.
xvi.
Differentiate between Parameter and Statistic.
Differentiate between Primary and Secondary Data.
What is Stem and Leaf Plot?
Define Probability.
Define Discrete Probability Distribution.
Define Mean of a Random Variable.
Describe the Parameters of Hypergeometric Distribution.
Write down the Mean and Variance of Standard Normal Distribution.
Define Random Sampling.
Define Lower and Upper Limit of Confidence Interval.
Write down the expression of Confidence Interval for Proportion.
Define Statistical Hypothesis.
Differentiate between Null and Alternative Hypothesis.
Define Test Statistic.
Define Regression.
What is meant by Nonlinear Regression Model?
SUBJECTIVE PART
(16 x 2 =
32)
ustadni.com
Maximum Marks: 48
Note: Attempt any three questions. All questions carry equal marks.
Q#2
Given the following grouped frequency table find the mean.
Class
111-115
116-120 121-125 126-130
131-135
136-140
141-145
146-150
151-155 156-160
Freq
Q#3
1
2
4
SIP
9
14
7
6
A group of 220 university students were asked how much time they spent using
Internet each week. The results have been tabulated below. Using this
information, calculate the standard deviation of hours spent on internet by the 220
students.
1
Hours
10-14
15-19
20-24
25-29
30-34
35-39
40-44
No. of students
2
12
23
60
77
visit website:
38
8
ustadni.com